CV GIANCARLODINARDO.6@GMAIL.COM
Case Studies Creative Blueprints Creative Library Playbooks The Creative System About Me Get in touch
Case Studies / Windows & Doors

The fix wasn't a new campaign. It was removing three old ones.

A US windows and doors installation company spending $60k a month on Meta had the creative assets and the market demand. What it lacked was focus. A structured consolidation and scaling approach fixed the account and doubled monthly spend over eight months.

Vertical
Windows & Doors
Platform
Meta
Monthly Spend
$60k–$130k/mo
Role
Lead Media Buyer
Eight-month performance delta
38%
CPL reduction
$170$105
+10pt
Set rate lift
18%28%
23%
Duplicate lead rate
eliminated

The account was generating leads. The math just didn't work.

CPL had drifted to $170. Cost-per-demo was above the $750 target. The set rate, the share of leads that booked a sales appointment, had fallen to around 18%. On paper, volume looked acceptable.

Underneath, too many campaigns were competing with each other. Budgets were spread across unvalidated geographies. The best creatives had been running long enough that frequency was quietly eroding performance. Nobody had applied a consistent framework to decide what stays on and what comes off.

The account kept growing horizontally: more campaigns, more adsets, more markets. What it needed was the vertical discipline of cutting what wasn't earning its budget.

Core constraint

Three problems running at once: inflated CPL, falling set rate, and a 23% duplicate lead rate that made everything look better than it was.

Set rate is the percentage of leads that book a sales appointment. Cost-of-marketing (CoM%) is total ad spend divided by revenue generated. In home improvement lead gen, CoM% is the primary profitability signal at the business level.
Baseline metrics
Cost per lead $170
Set rate ~18%
Duplicate lead rate 23%
Cost of marketing % ~29%

Four decisions, applied in sequence.

Every strategic move came from the data already in the account. No new campaigns launched until the existing structure was cleaned up and the budget freed from underperformers had somewhere productive to go.

SCATTERED CONSOLIDATED $170 $105 CPL TRAJECTORY
01
Enforce the performance filter
Every live ad and adset was evaluated against four thresholds: CPL below $150, set rate above 24%, cost-per-demo below $750, CoM% below 23%. Anything failing two or more thresholds across a 28-day and a trailing 14-day window was cut. The rule sounds mechanical. The discipline is not making exceptions for ads that feel like they're about to turn around.
02
Concentrate budget by geography
A zip-level cost-per-sold analysis showed Kansas producing meaningfully better downstream economics than any other market in the account — lower cost-per-demo, higher show rate, stronger close rate from the sales team. It was not marginal. Kansas got its own dedicated adset instead of competing inside a general multi-state campaign where its signal was diluted by underperforming markets. Budget freed from cuts went there first. That single reallocation was the structural decision that made every subsequent result readable.
03
Eliminate the duplicate lead contamination
At 23%, nearly one in four leads was a repeat submission — inflating volume metrics and masking real set rate performance. A full exclusion list rebuild using CRM data and phone-number deduplication removed the noise. Downstream numbers improved without touching a single campaign structure.
04
Switch to county-level CBOs with callouts
A zip-level analysis showed certain counties were dragging account CPL without contributing proportionate volume. County-level CBOs with location callouts in the creative improved relevance and reduced out-of-area lead contamination. Airport-proximity zips were excluded.
Creative

What the account was capable of, once it had room to prove it.

The geo-static format had been in the account before the restructure. It had not had a clean environment to show what it could do. Once the underperformers were removed and budget was concentrated into validated markets, the same creative logic that had been running alongside noise finally had the structure to perform. The two winning statics and the installation video tested alongside them tell the story of what the account produced once the work was done.

Winner
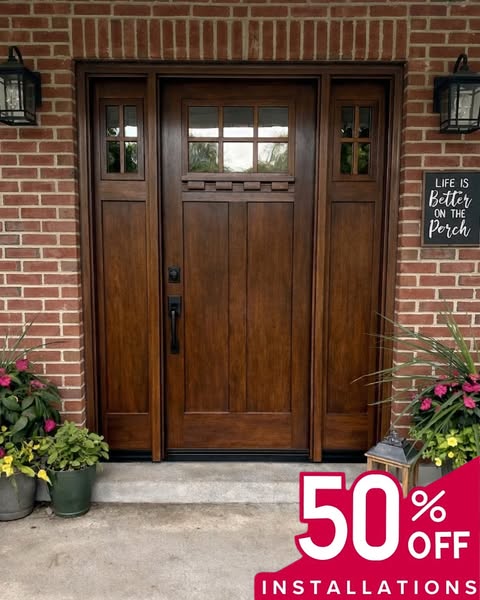
Geo-targeted product static — Brown Door
Real installation photo of a craftsman-style door on a brick home, with a bold 50% off badge and geo callout in the copy — "KANSAS Get 50% OFF..." The structural decision to concentrate budget into Kansas created the conditions this ad needed. The product showed the homeowner what was possible, the geo told them it was available in their market, and the offer gave them a reason to act now. It was not a new creative. It was the same creative given a focused account to run in.
Strongest set rate in the batch. Led the Kansas broad 35+ adset — the geography the restructure had prioritised.
Winner
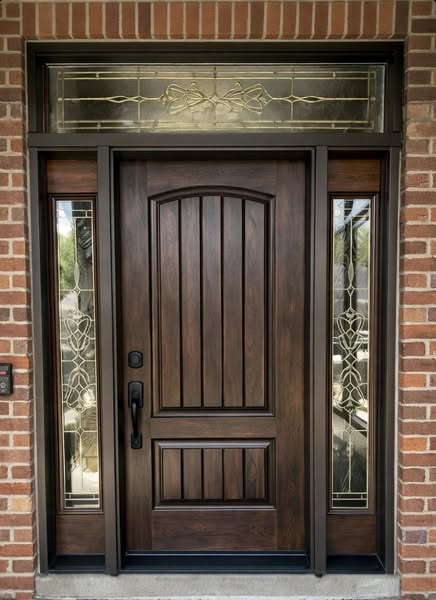
Geo-targeted product static — Dark Door
Premium dark walnut door with arched transom and ornate leaded glass sidelites. Geo copy: "ST. CHARLES COUNTY Get 50% OFF Window & Door Installation." The county-level CBO rebuild had created dedicated infrastructure for St. Charles — this ad was the creative proof that the structure worked. A different product style, a different market, the same format logic. That consistency confirmed the approach was replicable, not a one-market anomaly.
Format confirmed across markets. Validated the county CBO approach at the creative level — geo specificity in structure and in the ad itself.
Tested
Installation process video
Technician on a ladder installing a window on a brick home exterior. Text overlay: "New windows aren't just pretty." Hook challenged the purely aesthetic assumption — implying energy savings and home performance rather than curb appeal alone. A structurally different entry point from the product statics: credibility and craft rather than aspiration and offer. Tested alongside the geo-statics to understand which buyer moment the format reached.
Lower set rate than the geo-statics. The process hook reached an earlier-stage buyer — more interested in the craft and the company than ready to book. Useful for awareness but not the right primary for a conversion-focused account structure.

The numbers moved. And the sales team felt it before the dashboard showed it.

CPL dropped from $170 to $127 in the first two months, then to $105 by month eight. Set rate recovered from 18% to around 28% as lead quality improved alongside targeting precision. For the client's sales team, the shift was felt before it was fully measured: fewer calls that went nowhere, more homeowners who were in-area and expecting a callback.

$105
Cost per lead
$170$127 in 2 months, then $105 by month 8
28%
Set rate
~18%28% as in-area lead quality improved
$735
Cost per demo
Down from ~$930 at baseline
Target: $750 — achieved month 8
21%
Cost of marketing %
~29%21%, within target range
What I Took From This

Three things that now inform every account I run.

1.
The performance filter only works if you apply it without exceptions. Every account has ads that feel like they're about to turn around. The ones that consistently failed two or more thresholds across multiple time windows never did. Cutting faster is always the right call.
2.
Geographic concentration beats geographic ambition at most budget levels. The Kansas campaign outperformed broad multi-state campaigns not because the market was inherently better, but because creative, copy, and budget were aligned to one geography. The Brown Door geo-static leading with "KANSAS" in the copy was not just a targeting decision — it was a creative decision that matched the structural discipline of the campaign rebuild. That alignment is what moved CPL from $170 to $105 and set rate from 18% to 28%. Scattered accounts produce scattered signals. Concentrated ones produce results you can read and act on.
3.
Duplicate lead rate is an underestimated CPL distorter. At 23%, nearly one in four leads was a repeat submission inflating volume metrics and masking real set rate performance. Fixing the exclusion lists improved downstream numbers without touching a single campaign.
01 Cut without exceptions CPL · SET RATE · DEMO COST · COM% 02 Concentrate geographically KS MO IL BUDGET FOLLOWS SIGNAL 03 Eliminate the noise 23% DUPES ALENCO HOME
Before the work
CPL at $170 with no systematic framework for deciding when to cut
Set rate at 18%, with strong lead volume masking poor lead quality
23% duplicate lead rate inflating volume metrics across the account
No exclusion logic in place — same leads re-entering the funnel repeatedly
Budget spread thinly across all-zips campaigns with no geo concentration
After the work
CPL at $105, driven by cutting underperformers and concentrating on validated markets
Set rate recovered to ~28% as in-area lead quality improved
Duplicate rate eliminated following CRM-backed exclusion list rebuild
Spend scaled from $60k to $130k monthly — not because the account grew, but because it had finally earned the right to scale through validated performance
County-level CBOs with geo callouts focused spend on the highest-converting markets
The first question before touching anything: creative problem or structure problem?
The Diagnosis playbook covers how to separate creative performance from media buying performance before drawing any conclusions. The thresholds and decision logic used in this account came from running that process first. Read it →
How the county CBO structure and geo callout creative work in practice
The Creative Coverage playbook covers the three-campaign model, the CBO versus ABO decision, and how to give testing and scaling separate infrastructure so they stop competing for the same budget. Read it →