CV GIANCARLODINARDO.6@GMAIL.COM
Case Studies / Bath Remodeling

One state was carrying five. Finding it took a different kind of audit.

A US bath remodeling company operating across multiple states had acceptable aggregate metrics and a serious market-level problem. Missouri was silently absorbing budget and dragging account-level results. A state-by-state creative audit found the signal buried in the noise and built a repeatable framework from it.

Vertical
Bath Remodeling
Platform
Meta
Monthly Spend
$40k → $110k (scaled during the engagement)
Role
Lead Media Buyer
Key results from this engagement
25%
CPL reduction
$114 → $85 avg. across states
17%
Cost of marketing
down from 25%, target ~21%
6
States audited
one creative hierarchy

Good top-line numbers. A broken picture underneath.

The account ran across a wide geographic footprint and the aggregate CPL, around $114, looked within range. The problem was that Missouri, which had a large audience size, was absorbing a disproportionate share of spend in all-zips campaigns and quietly dragging down results everywhere else. Spend in Missouri was subsequently capped and redirected to stronger markets.

The deeper issue was creative. Some ads were generating strong lead volume while producing near-zero sales. That pattern only becomes visible when you look at lifetime data by ad, evaluated all the way through to close rate. Looking only at CPL, those ads appeared healthy.

There was also a structural retargeting problem. The campaigns ran as CBOs with two adsets sharing one budget. One adset was much larger than the other. A CBO almost always starves the smaller audience, which in this case was the hotter, closer-to-converting one.

Core constraint

CPL looked acceptable. Sales per creative did not. The account needed to be evaluated at the sale level, not the lead level, before any scaling decisions could be trusted.

Criteria used for the audit: 5 or more sales, set rate above 30%, close rate above 30%. Ads falling short of these but with strong CoM% or CPL were flagged separately for further testing rather than discarded.
Baseline metrics
Cost per lead ~$114
Cost of marketing % ~25%
Set rate ~20%
Retargeting structure CBO (2 adsets)

Audit first. Scale second.

The same CPL was producing very different outcomes across segments. The problem was not volume. It was how performance was being interpreted.

01
Separate sale-level signal from lead volume
The account had enough history to stop judging creative by CPL alone. I started by comparing state-level performance against set rate, close rate, and sale quality so the next creative decision was based on business outcome rather than lead volume. That changed which ads looked like winners.
02
Build the creative hierarchy
Candid creatives became the primary scaling vehicle. The 3-requirements video format became the secondary format for new market launches. Banner-style ads were deprioritized except in Rhode Island, where a generic banner produced a 57% close rate across four sales.
03
Concentrate cold traffic budget on Kansas and Atlanta
Kansas had the strongest historical CoM%. Atlanta's city CBO produced early sales in Peachtree City and Marietta. Geo-specific CBOs with location callouts replaced all-market campaigns with generic copy. Missouri's budget share was capped to stop it absorbing spend disproportionately.
04
Rebuild retargeting as ABO
Mid-funnel audiences (FB engagers, 3s and 10s video viewers, 180-day window) got their own budget. Bottom-funnel (website visitors last 30 days) got its own budget. Each temperature of audience received individual daily spend rather than competing inside a shared CBO.
Creative

What the state-by-state audit taught us about creative format.

The audit produced a consistent finding across markets: close rate and set rate diverged sharply between creative types even when CPL was similar. Format mattered more than cost.

Winner
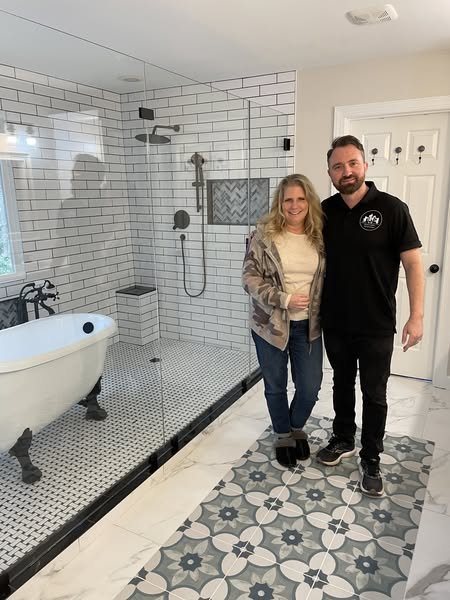
Candid — Atlanta market
Customer photographed in or near the finished space. Produced 2x the close rate of the account average and a below-average CPL. Promoted to primary scaling creative and cross-deployed into the Kansas CBO.
6 sales, double average close rate, below-avg CPL
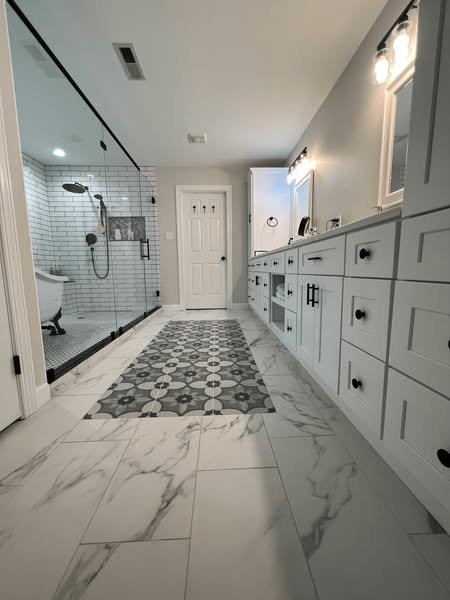
Winner
Candid — Maryland
Consistent top performer in the state audit. 12 sales, 47.7% set rate, 30% close rate. Became the template for what a strong candid format looks like in this vertical.
12 sales, 47.7% set rate, 30% close rate
Winner
3-requirements video — Florida
Qualifier-style hook filtering by location and project criteria. 24 sales at 38.7% close rate. Became the standard format for new market launches where the candid library was not yet built out.
24 sales, 38.7% close rate in Florida
Learning
New Inspo 2 video
Strong CoM% when paired with interest-based audiences in Kansas and St. Louis. Weak CoM% in broad adsets. Held back from broad scaling but retained for interest-stack testing where audience composition improved results materially.
11.8% CoM on interest stack — better than its broad adset performance
Learning
Banner — Rhode Island exception
Generic banner format underperformed candids in every other state. Rhode Island was the outlier: 57% close rate across four sales. Kept active for RI only. The lesson was not to drop a format entirely before checking if a single market was propping it up.
57% close rate in Rhode Island only
Tested
Urgency copy on retargeting candids
Retargeting candids had generated solid lead volume in prior campaigns but closed zero sales. The hypothesis was that location callout copy, designed for cold audiences, was wrong for warm ones. Relaunched with urgency and scarcity copy instead.
Prior version: 6 demos, 0 sales with location copy

CPL dropped. CoM% beat the target. The creative hierarchy became a launch template.

The account brought cost of marketing down from 25% to 17%, beating the internal target of ~21%. CPL dropped from $114 to an average of $85 across states, with some markets reaching below $50. The deeper win was structural: a ranked creative framework that made new market launches faster and more predictable.

$85
Cost per lead
Down from ~$114. Some states reaching below $50
17%
Cost of marketing
Down from 25%, beating the ~21% target
26%
Set rate
Up from ~20% at baseline
6
States ranked
One consistent creative hierarchy across all of them
What I Took From This

The audit model now runs on every account I take over.

1.
Close rate and set rate are more predictive of creative value than CPL alone. Several ads in this account had strong CPLs and were producing leads that never converted. Reorienting the optimization logic around the full funnel, not just the cost of the lead, changed which ads deserved budget.
2.
CBO structure interacts with audience temperature in ways that are easy to miss. A campaign that looks balanced at the budget level can be systematically starving the audiences most likely to convert. Moving retargeting to ABO gave predictable results where the CBO had not.
3.
Geographic budget concentration compounds. Every dollar redirected from Missouri into Kansas and Atlanta generated more signal on those markets faster, which enabled sharper optimization decisions, which improved performance further. The feedback loop accelerates when you stop spreading thin.
Before the work
CPL at $114 with no creative hierarchy to guide what to scale
Missouri absorbing disproportionate spend and dragging account-level results
Retargeting CBO starving the hottest audiences of budget
Some top-CPL ads generating zero sales, invisible without sale-level analysis
New market launches starting from scratch each time with no template
After the work
CPL at $85 avg. across states, with some markets reaching below $50
Missouri spend capped. Kansas and Atlanta receiving concentrated, geo-specific budget
Retargeting rebuilt as ABO with mid-funnel and bottom-funnel on separate budgets
Creative decisions tied to close rate and set rate, not just CPL
New markets launched with candid-first, 3-req video second as the proven starting template
Why the same CPL can hide completely different business outcomes
The Diagnosis playbook covers how to read creative performance at the sale level rather than the lead level, and how to separate which problems belong to the creative from which belong to the creative coverage. The audit logic in this case study starts from that framework. Read it →
Why more creative volume does not fix a coverage problem
The Creative Coverage playbook explains why distinct concepts, personas, and formats expand reachable demand, while more versions of the same signal just buy repetition. Read it →
How the ABO retargeting rebuild works structurally
The Creative Coverage playbook covers why a CBO with audiences of different temperatures almost always starves the hotter one, and how moving to ABO gives each audience its own budget and predictable delivery. Read it →